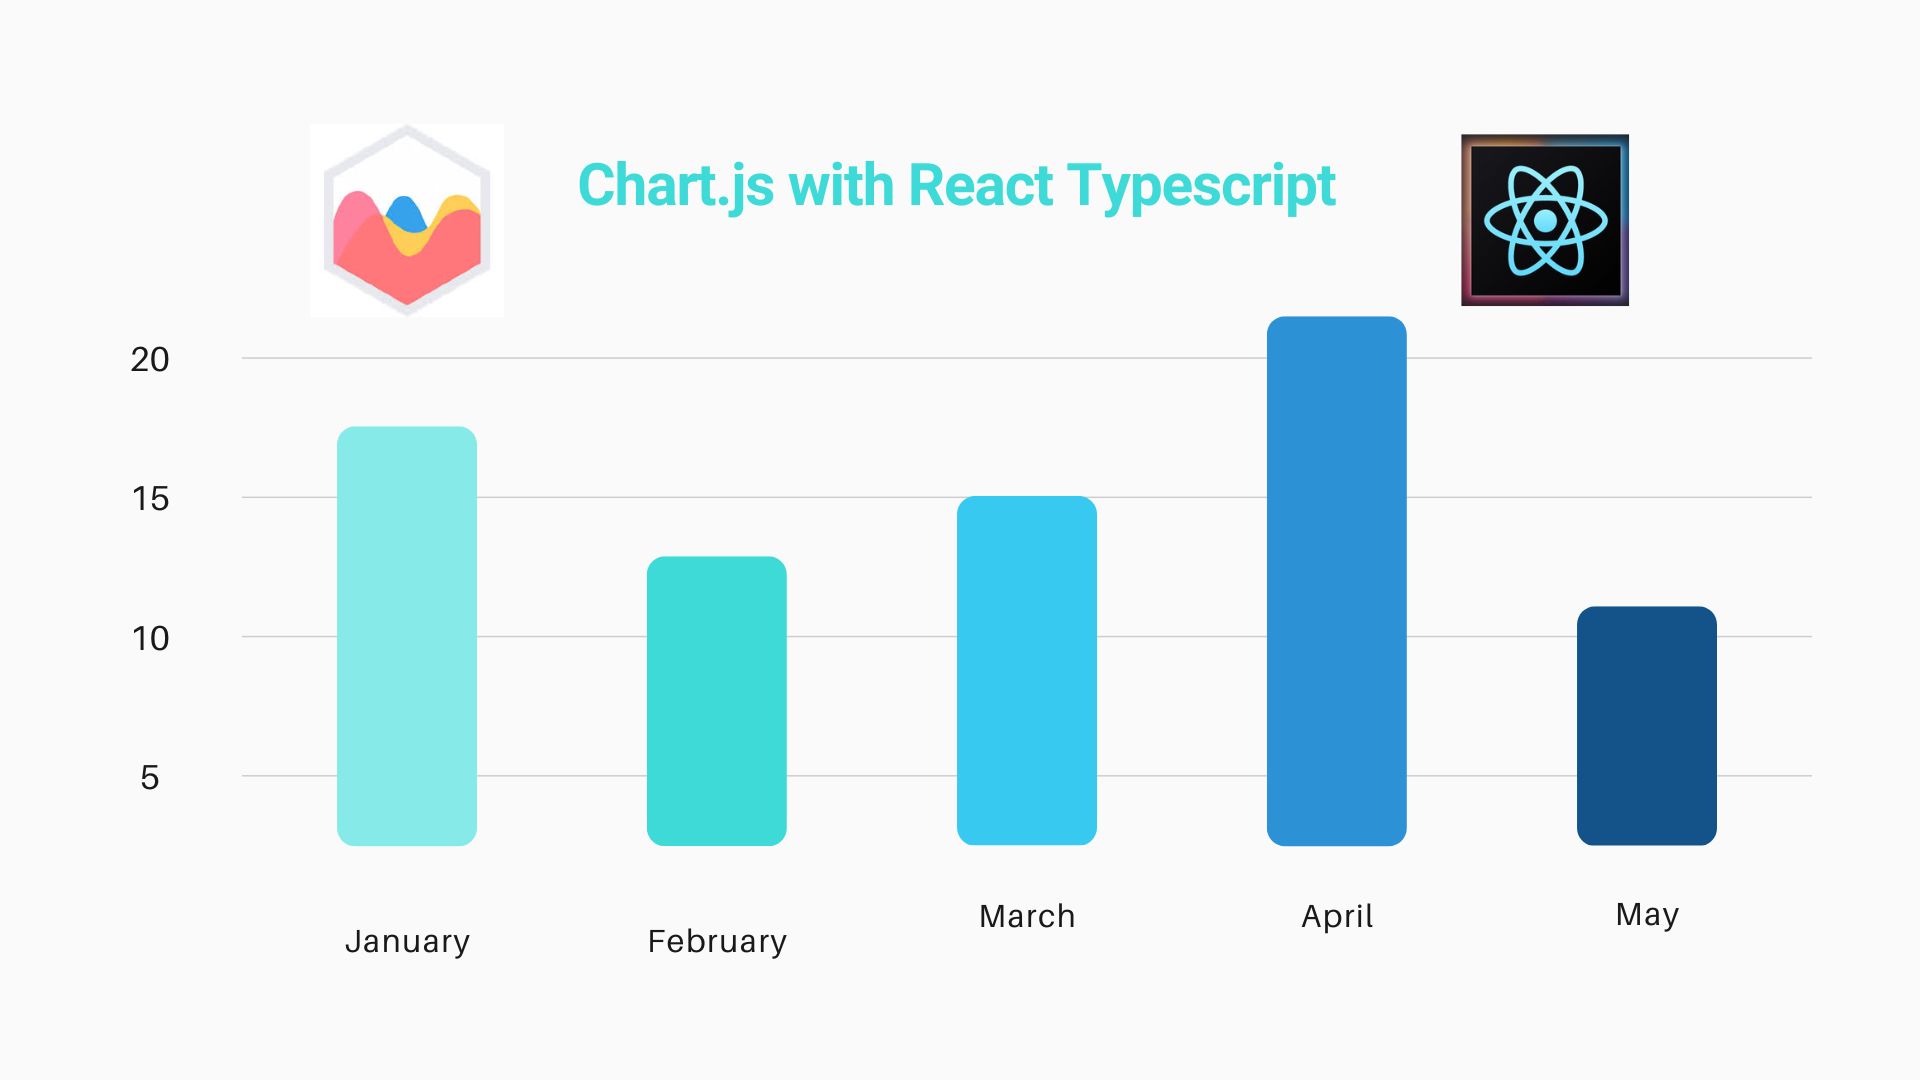
Chart.js is a free, open-source JavaScript library for data visualization. Its one of the most popular yet simplest visualization libraries in JavaScript.
Chart.js is written in JavaScript, therefore it is easy to use it in plain JavaScript. However it is a pain to integrate it with React Js. For that purpose we will use another wrapper library react-chart-js-2. In this post we will integrate it React Typescript project.
Follow these steps
Install the required packages
npm install --save chart.js react-chartjs-2Declare chart data
In this case we will use the bar chart as an example. Go to the component to which you want to integrate the chart. Let us set the data that will be used by the chart in React state.
// put this inside the react component
const labels = ['January', 'February', 'March', 'April', 'May', 'June', 'July'];
const [data, setData] = useState({
  labels: labels,
  datasets: [{
    label: 'Expenses by Month',
    data: [65, 59, 80, 81, 56, 55, 40],
    backgroundColor: [
      'rgb(153, 102, 255)'
    ],
    borderColor: [
      'rgb(153, 102, 255)'
    ],
    borderWidth: 1
  }]
});
Use the Chart Element
Time to add the chart element in the component template.
<Bar data={data} />At this point if you try to refresh the browser you will see that the Chart will not render. Instead you will see some error messages in the browser console stating that some chart elements are not registered.
This is because Chart.js 3 is tree-shakeable, so it is necessary to import and register the controllers, elements, scales and plugins you are going to use.
Register the Chart Elements
The elements that you will need to register will depend on the Chart type that you are using. In case of the Bar Chart we will need to register the following elements.
ChartJS.register(
  CategoryScale,
  LinearScale,
  BarElement,
  Title,
  Tooltip,
  Legend
);
To learn more about all available elements see Chart.js documentation.
Now if you reload the page again you should see the Chart rendered correctly.

Here is the full component code
import {
  Chart as ChartJS,
  CategoryScale,
  LinearScale,
  BarElement,
  Title,
  Tooltip,
  Legend,
} from 'chart.js';
import { useState } from 'react';
import { Bar } from 'react-chartjs-2';

ChartJS.register(
  CategoryScale,
  LinearScale,
  BarElement,
  Title,
  Tooltip,
  Legend
);
export const DemoComponent: React.FC<{}> = () => {
  const labels = ['January', 'February', 'March', 'April', 'May', 'June', 'July'];
  const [data, setData] = useState({
    labels: labels,
    datasets: [{
      label: 'Expenses by Month',
      data: [65, 59, 80, 81, 56, 55, 40],
      backgroundColor: [
        'rgb(153, 102, 255)'
      ],
      borderColor: [
        'rgb(153, 102, 255)'
      ],
      borderWidth: 1
    }]
  });

  return <Bar data={data} />;
};
Updating the Chart with new Data
The Chart will re-render automatically whenever the data is changed using setData
setData({
  ...data,
  datasets: [{
    ...data.datasets[0],
    data: [1, 2, 4, 8, 16, 32, 64]
  }]
});


